
Coronavirus (COVID – 19)
Test, Trace, Isolate and Treat
This page was last updated on October 15, 2020. Refresh for the latest.
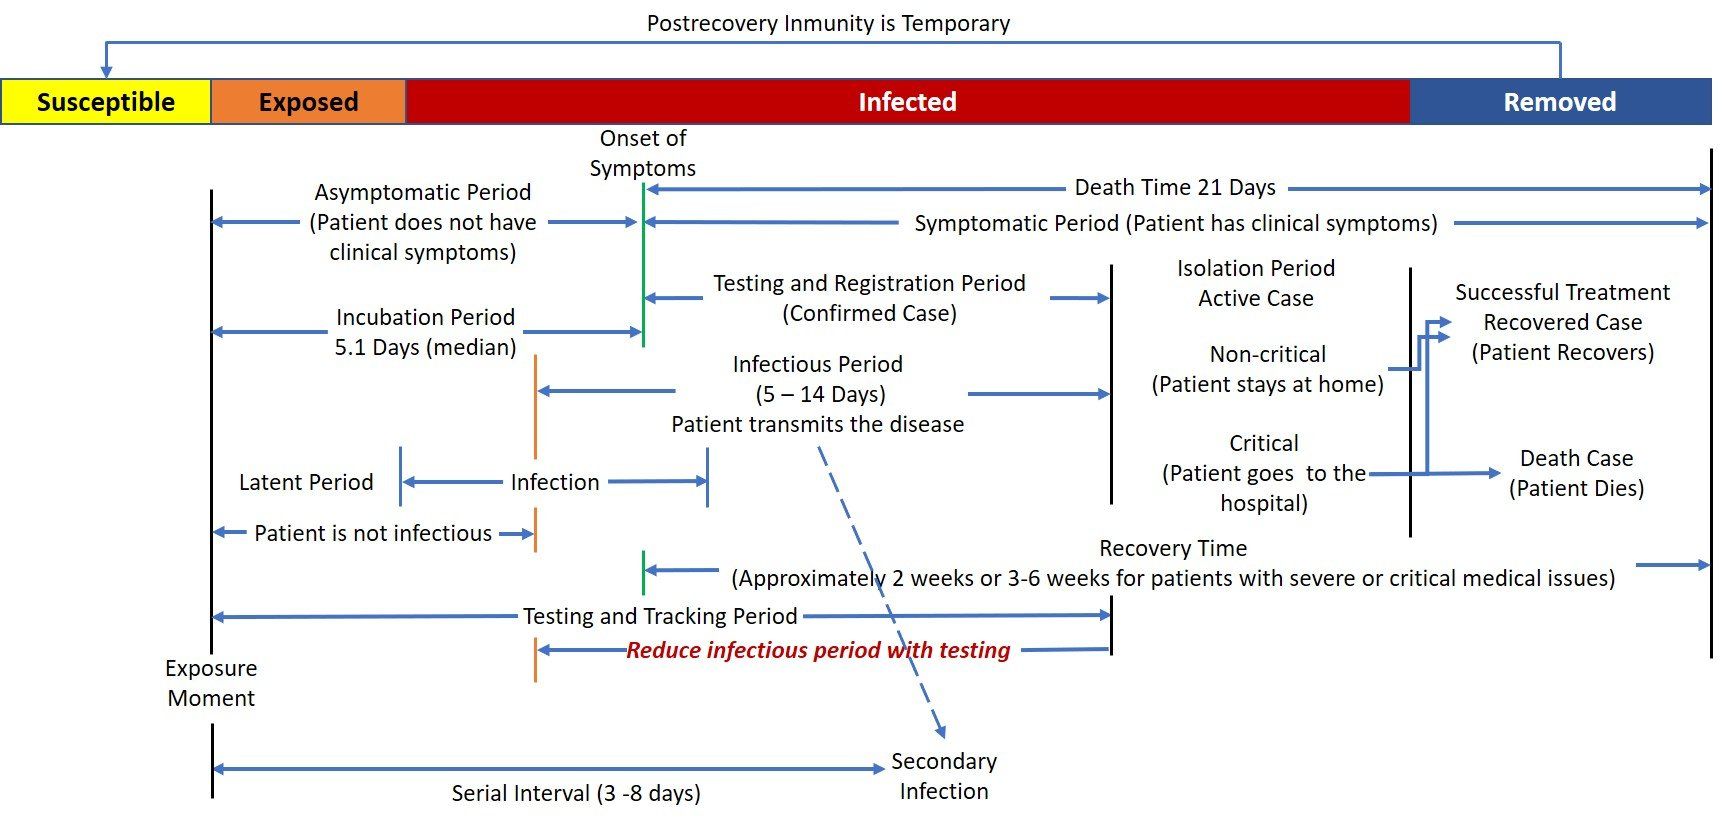
In a compartmental model, first people are Susceptible, then Exposed to the pathogen but not yet contagious, Infected, and later Removed through recovery or death. If post-recovery immunity is temporary, then recovered people are back to the susceptible compartment.
Incubation is the period between exposure and onset of clinical symptoms. The period between exposure and infection is called 'latent period', the pathogen is present in a 'latent' stage, but there are no clinical symptoms or signs of infection. At the infection period, which may be symptomatic or asymptomatic, the pathogen will multiply, and the host immune system will start a response. There are no clinical symptoms yet. The host may become infectious (i.e. able to transmit the pathogen to other hosts) at any moment of the infection. The patient stars showing clinical symptoms.
Once the patient starts showing symptoms, it becomes an
Active case, and it should begin the isolation period at home if the case is non-critical or at the hospital if the case is critical. After some time, the patient either recovers or dies.
Social Trust
From the Wire Magazine, July - August 2020, How to Make Government Trustworthy Again by Gideon Lewis-Kraus, https://www.wired.com/story/how-to-make-government-trustworthy-again/
"Why have some Asian countries controlled their outbreaks so well? It's because authorities have earned their citizens' confidence."
"Social trust, in this generalized sense, is an ill-defined concept that encapsulates a variety of otherwise distinct phenomena: trust in the government as a whole, trust in the relevant authorities in particular, and ultimately trust in one's neighbor. It was, in any case, something that made people prone to listen to their leaders, wear masks in public, and stand 6 feet apart rather than where they pleased."
In the US, the Public Trust in Government went from 73% in 1958 to 19% in 2015. Trust by Esteban Ortiz-Ospina and Max Roser, https://ourworldindata.org/trust.
Countries with higher social trust in the government like South Korea, Japan, Taiwan, Sweden, China, New Zeeland, and Germany, have been more successful in controlling the coronavirus pandemic because of their cultural willingness to accept and follow government guidelines.
Game Theory and COVID-19
Game theory analyzes the interaction results of several players in which the outcome of one’s choices depends upon the decisions of others.
For example, Alice and Bob are going to get together for a meeting. Both are afraid of getting the Coronavirus, and both are committed to reducing the pace at which the epidemic is rising. Neither knows if they are already infected. Wearing masks protects one from getting infected by the other. If Alice wears a mask, Bob is protected, and if Bob is wearing a mask, Alice is protected. Staying at a certain distance will protect both. The optimal payoff occurs when no one gets infected.
Question: What should be Alice’s and Bob's optimal decision-making, given the set of circumstances?
Answer: Alice and Bob should wear masks and stay at least six feet apart.
Ahhh.. Now I understand why to wear a mask. Ahhh.
We confuse individualism with social responsibility and believe that individualism is more important than social responsibility. Wearing a mask is a social responsibility.
Definitions
- Confirmed Cases: Number of positive cases identified through COVID-19 testing since the pandemic started in a region, country, or worldwide. The Confirmed cases is a cumulative number, day-by-day it could increase, but never decrease.
- Deaths: Number of people who have died from COVID-19 since pandemic started in a region, country, or worldwide Death number is a cumulative number; it could increase but never decrease.
- Recovered Cases: Number of people who have recovered from COVID-19. The Recovered cases is a cumulative number, day-by-day it could increase, but never decrease.
- Active Cases: Number of people who are currently infected with COVID-19. The number of active cases increases at the beginning, then, hopefully, flattens out and starts reducing. Based on (1), we can say that the number of Active cases is calculated as follows:
Active Cases = Confirmed – Deaths - Recovered
Because confirmed, deaths and recovered cases are shown as cumulative numbers when tracked, it is not possible to determine if the epidemic is contained or not by just looking at the numbers. It is then necessary to calculate other values and ratios that could provide information on the epidemic status, increasing or receding.
According to the CDC, the basic reproduction number (R0) is an epidemiologic metric used to estimate how fast an epidemic will spread or recede when no control measurements are implemented to curb the spread of the virus. It is important to note that R0 is a dimensionless number and not a rate, which would have units of time. Also, R0, is not a biological constant for a pathogen, a rate over time, or a measure of disease severity. R0 cannot be modified through control measurements.
When there are some control measurements, some immunity, or some intervention measures are in place, i.e., wear a mask and stay six feet apart, mathematicians and epidemiologists refer to R, as the time changing effective reproduction factor, Re(t). For example, how many people does one person infect on a given period t.
The Re(t) calculations include a distribution from which the observed serial intervals origin is; it is called the serial interval distribution, and depending on the calculator, the calculation also includes many other factors.
See https://staff.math.su.se/hoehle/blog/2020/04/15/effectiveR0.html for three different estimation methods of the effective reproduction factor, Re(t).
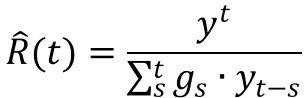
The instantaneous reproduction number is another reproduction number estimator. Opposite to the forward looking approach of most pandemic calculators, the instantaneous reproduction number is defined backward in time; it compares the number of new infections on day
t with the infection pressure from the days prior to
t.
R numbers are references on how many new infections will each existing infection causes. R<1, R=1, or R>1.
All these reproduction factors calculations are based on accumulative numbers of new cases or deaths, which day-by-day changes are positive numbers. But, cumulative Active numbers, first increase, and then, when the pandemic is contained, they start decreasing. Therefore, day-by-day changes can be positive or negative numbers, and the tools don’t work with negative numbers.
Herd Immunity
An individual acquires immunity either by surviving an infection or through immunization. The same acquired immunity, when scaled to a population, is called herd immunity. When a sufficient number of the population is immune to the infection, people who aren't immune, susceptible individuals, are protected indirectly by onward transmission. People are immune when either they recover from the disease, Recovered, or are vaccinated. Therefore, the population's current immune state is the number of Recovered plus the number of vaccinated people.
When herd immunity is achieved, disease spreading will decline and stop, and some of the restrictions may be lifted.
The Guide to COVID-19, Section 2.2, discusses the basic and effective reproduction numbers, R0, and Re(t). The basic reproduction number, R0, assumes that all the population is susceptible. In this circumstance, the classical herd immunity, hc, is equal to
hc = (1 – 1 / R0)
The effective reproduction number Re(t) will vary depending on a population's current immune state, which changes as the vaccination campaign unfolds and can be written as
Re(t) = s R0
Where:
s = fraction of the population that is susceptible to catching the disease.
1 - s = fraction of the immune population (Recovered + vaccinated x vaccine efficacy).
The basic reproduction number, R0, assumes that all the population is susceptible. Therefore is s =0, then, Re(t=0) = R0. Then, at any time t, herd immunization is equal to
hc = 1 – 1 / Re(t)
Suppose the vaccine is not perfect but instead reduces susceptibility by a fraction E (so E = 1 corresponds to 100% efficacy). In that case, of all the vaccinated people, the number of immune people is smaller by a factor of E. If the vaccine efficacy is 0.95, then of 1000 vaccinated people, only 950 are immune (1000 x 0.95).
Total Immune Population = Recovered + Vaccinated * Vaccine Efficacy(t)
Any control, wearing a mask, distancing, or vaccination aims to get the effective reproduction number to less than 1.
Re(t) < 1
s R0 < 1
s < 1 / R0
1 - s ≥ 1 - 1 / R0
The value of Re(t) below 1 occurs at the time t, when the proportion of the population with immunity, 1 – s, exceeds the herd immunity threshold, (1 - 1 / R0).

Herd Immunization
Three assumptions are necessary to make when calculating herd immunization. (1) the R naught value to use; (2) how to calculate the recovered number of patients who have recovered; and (3) what vaccine efficacy to use; (4) Number of vaccinated people.
R naught
The R naught used in this website herd immunity calculations is equal to Ro = 3.27
Recovered Cases
According to the CDC, 81% of COVID cases are mild, 14% are severe, and 5% are critical. Because reported recoveries are not available for some regions, and based on the premises above, the University of Virginia’s Network Systems Science and Advanced Computing (NSSAC) introduced a formula to estimate the number of Recovered cases.
The estimation is calculated as follows:
Recovered (Estimated) = (81% of confirmed cases from 14 days ago + 14% of confirmed cases from 28 days ago + 5% of confirmed cases from 42 days ago ) – Deaths
Vaccine Efficacy
Immunity is not instantaneous; it takes time to develop. Body immunity changes are not a step function; they change gradually. A person's vaccine efficacy increases according to the number of days after the first and second doses. Based on Pfizer and Moderna efficacy data, the calculated efficacy is used to calculate what percentage of people is immune at any tday day after the first and second dose. The charts below show how Pfizer and Moderna immune efficacy change with time.
Number of Vaccinated People
The number of vaccinated people are taken from the University of Virginia’s Network Systems Science and Advanced Computing (NSSAC)
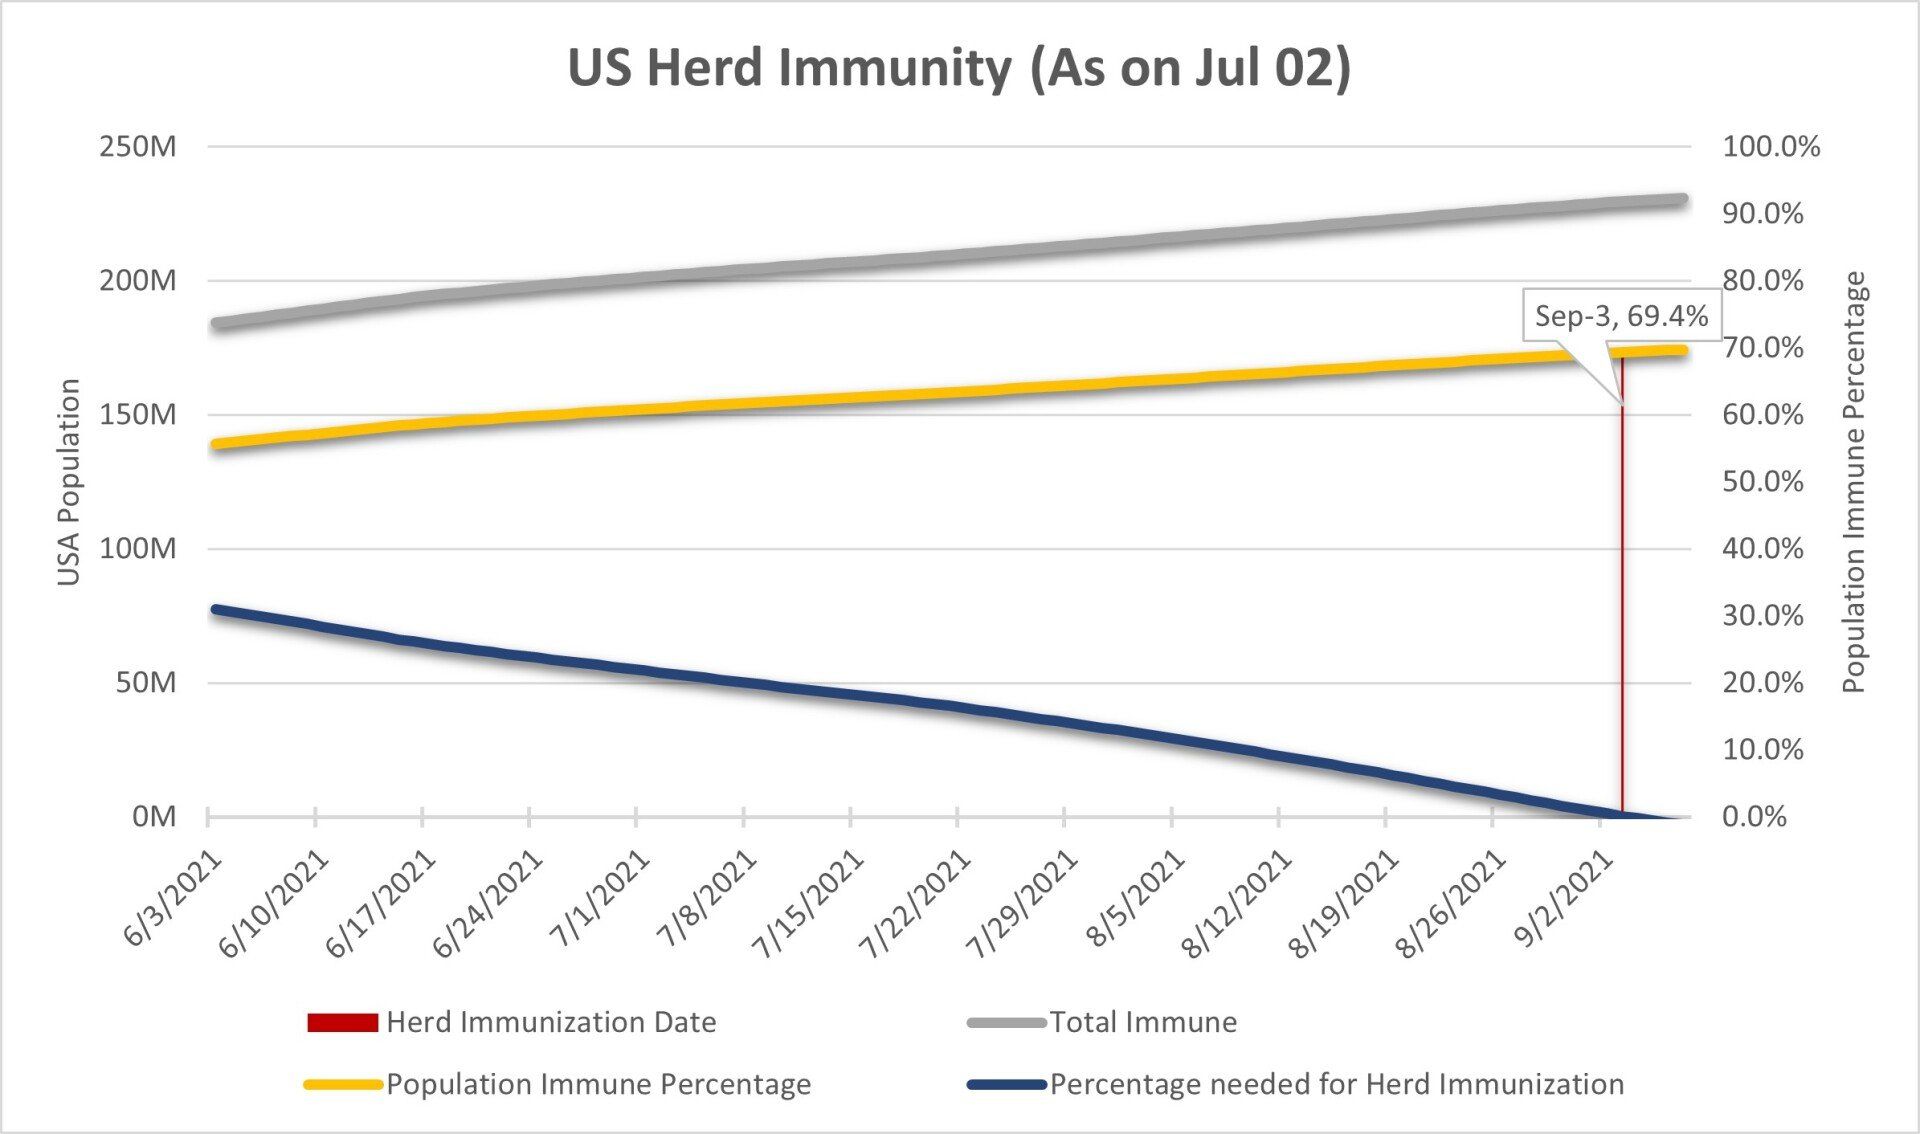
Figure 1 shows a US Herd Immunization forecast using an Ro = 3.27 . The blue line is the percentage of the population needed for herd immunization over time. The grey line is the number of immune people, as more and more people get vaccinated, and as the number of recovered people increases. The yellow line is the immune population percentage over time.
As time passes, the percentage of the immune population increases, and the requirement and time t for herd immunity decreases. A country achieves herd immunization when Re(t) ≤ 1, not in the graph, when the percentage needed for herd immunization is zero, or when the yellow line value is equal to the blue line's initial value. As on April 16, the US will reach herd immunity on May 3, 2021.
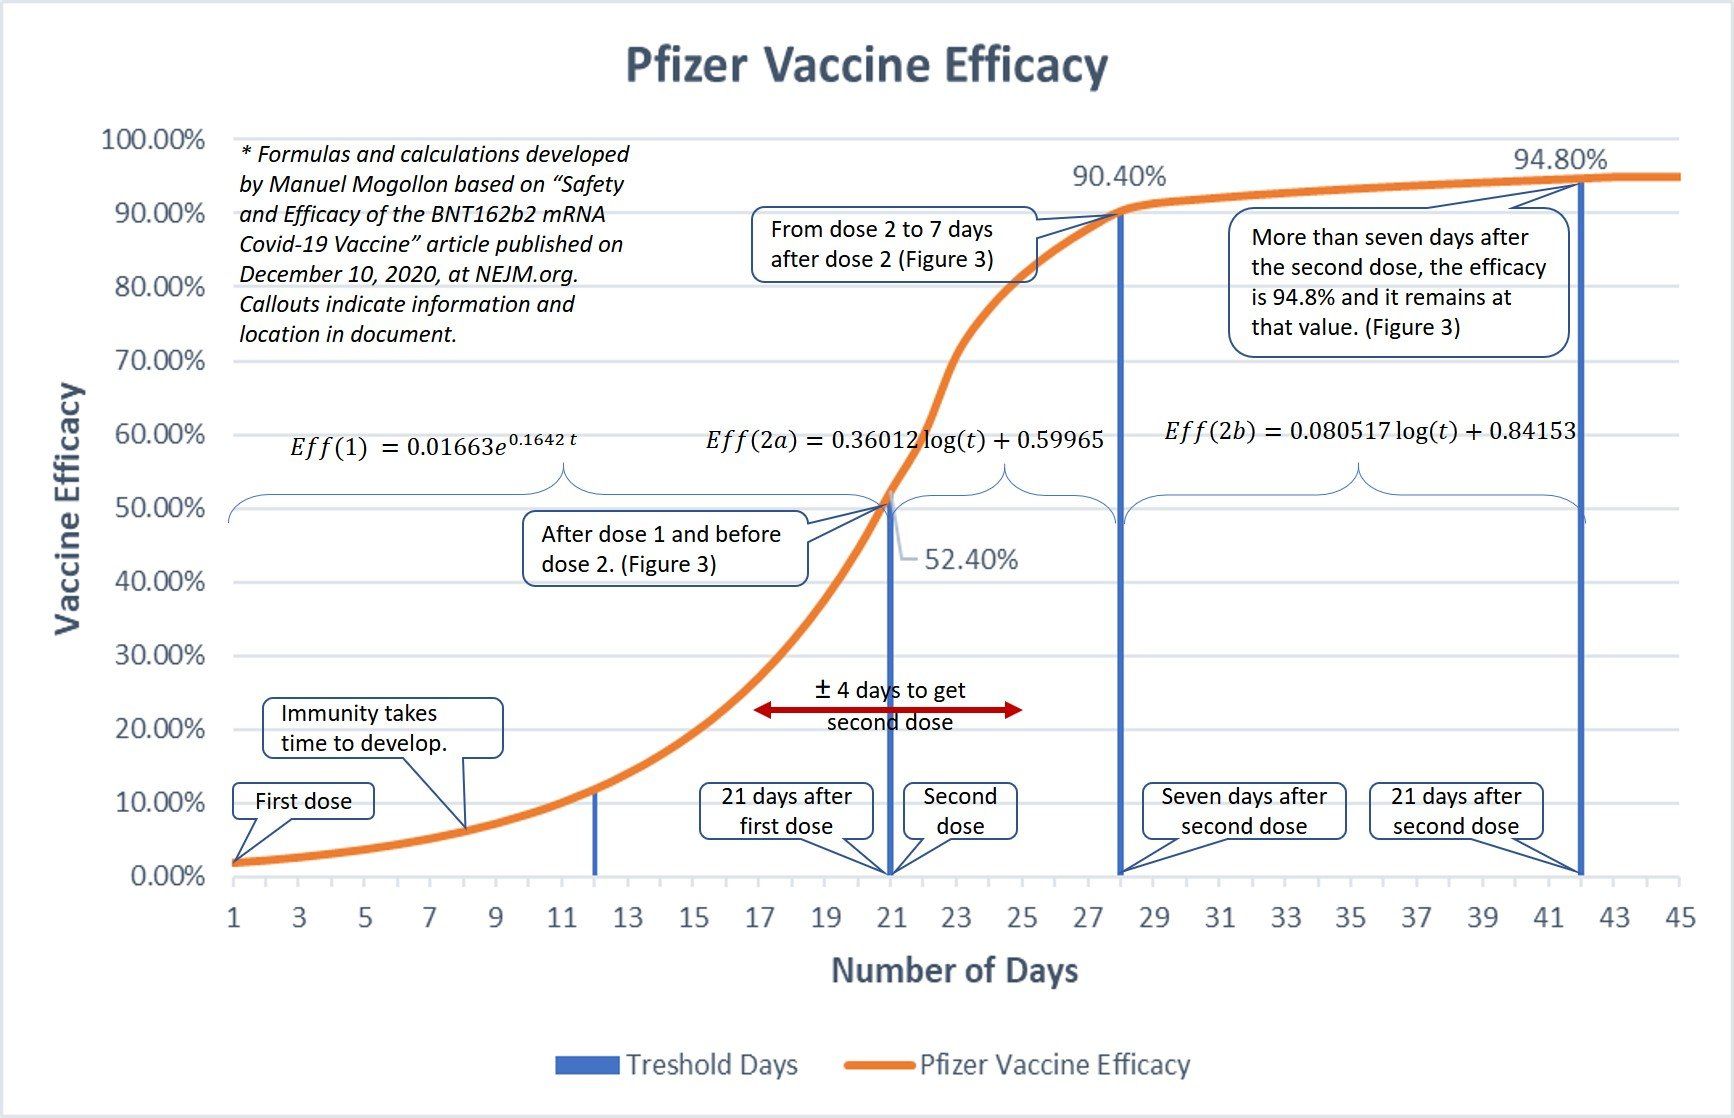
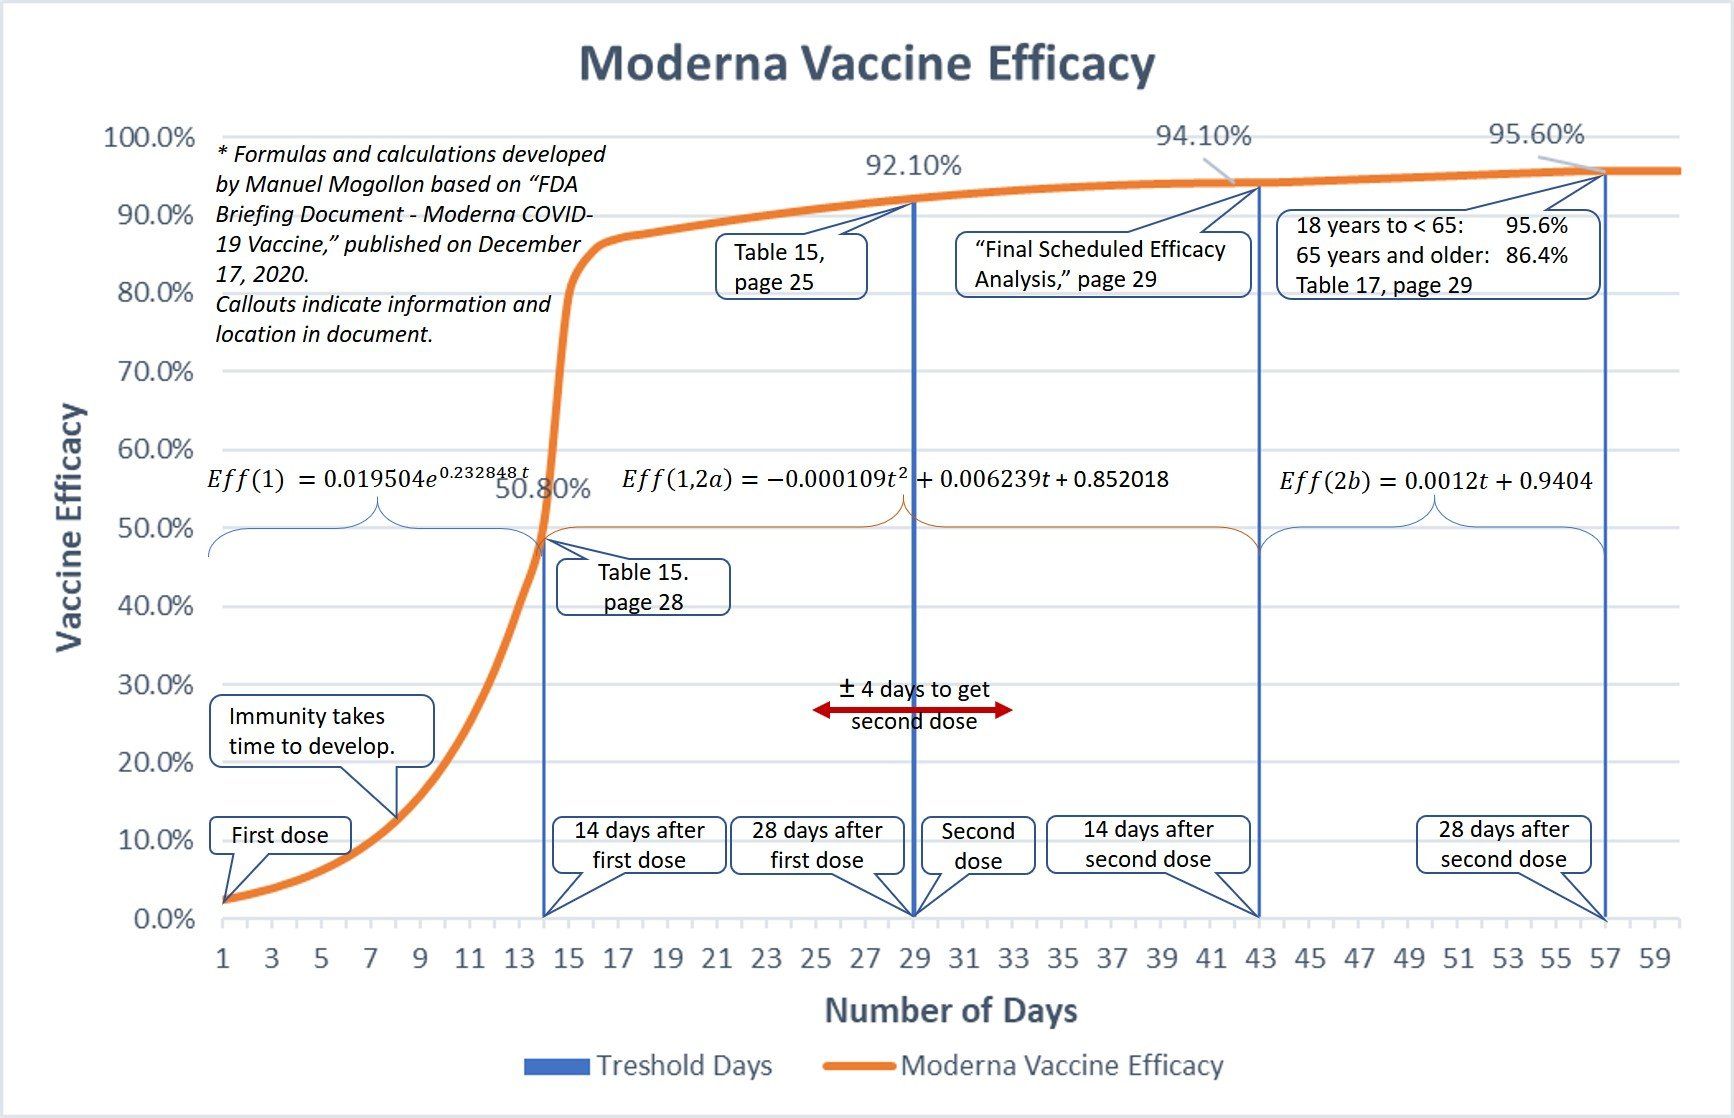
Figure 1 US Herd Immunity
R, the Constant Rate of Growth
Calculating R Based on Historical Measured Data
Compound annual growth rate (CAGR) is the rate of return that would be required for an investment to grow from its beginning balance to its ending balance. It is normally used to determine returns for individual assets and investment portfolios, but also on anything that can rise or fall in value over time, for example, the pandemic Active cases.
Since my interest is in the constant rate of growth, positive or negative, over a time period, and based on historical measured data, I decided to use the compound interest formulas to calculate the daily rate of increase or decrease of the pandemic cases. R here is not a number that indicates how many people a patient is likely to infect, but a rate that tells us the daily rate of increase or decrease of pandemic cases in a t period and to determine if, in that t period, the epidemic was receding or not in a specific geographical region. In this paper, R is not only a measure of direction, increasing or decreasing, but also a factor of the change.
One of the White House guidelines to start opening a State is the “Downward trajectory of documented cases within a 14 days period.” The sample should be taken for two days which are 14 days apart, for example, April 8 and April 22. In our case,
t = 14, and the average rate of change,
R, should be less than 1 during the previous 14 days.
Based on historical measured data, and the compound interest formulas, it is possible to calculate the daily rate of increase or decrease of pandemic cases in a t period.

Where,
V = Value (beginning and final)
y (n) = Number of infected people on day n
y (n + t) = Number of infected people on day n + t
t = Number of days
R = Constant factor of daily change during the t period.
The equations above show the US Active cases between August 7th and August 21st. The calculated value of R is the decrease rate per day of Active cases. Similar to the CAGR, when the daily rate of 0.988431 is applied for 14 days to the initial value of 1,020,579, the calculated final value is the same as the actual US active data, 867,157. The active numbers are decreasing, and the daily values, today’s minus yesterday’s, are negative. In investment, it is like having several months of negative returns, and in the case of a pandemic, a number lower than 1 means that the disease is declining and eventually will die out.
By using Equation 3 formula for R, it is possible to determine the rate at which an epidemic is increasing, R>1, or decreasing, R<1. It can be applied to confirmed, deaths, and recovered cases.
Confirmed, deaths and recovered cases are cumulative numbers, day-by-day they could increase, but never decrease. Therefore, R will never have a value lower than 1. It will start at a particular value, and then it decreases to its limit, which is 1 when there are no more new cases.
Epidemic Doubling Time
For the same days, August 7th and August 27th, Confirmed cases in the U.S. were 5,048,058 and 5,740,931, and R = (5,740,093 / 5,048,058)1/14 = 1.00923. Confirmed cases were at growing at 0.923% daily.
The number of days that it will take for a country to double the number of Confirmed cases is also an excellent indicator to determine if COVID-19 is receding or not. The following formula is used to calculate the number of days to double the number of cases.
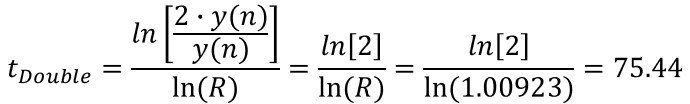
It is the same formula used to calculate how many years it will take to double your savings at a specific growth rate.
It is a good sign when the number of days to double increases; the epidemic is receding. If doubling times are getting shorter, then the epidemic spreading is accelerating.
Making Forecasts and Using Regression Analysis
Data-driven model can make accurate short-term forecasts, so in the forecast calculations, R is the Constant Daily Rate of Growth calculated for a period of 14 days. However, using R to forecast Configured, Deaths, and Recovered results in high differences between current and forecast values. The differences are linear in time and are like this: Confirmed: 4%; Deaths: 2.5%; Recovered: 7.5%; and Active: 35%.
I decided to change the formula to the following r = m * R, where r is the new Constant Daily Rate of Growth, and m is a factor. I use Excel LINEST(known_y's, known_x's, False, False), which returns a 1x2 array where the value in the first column is the slope of the trend line and the second column is the intercept. In LINEST(), the current values are the known_x's, and the forecast values are the known_y's. In a plot, when the x and y values are the same, the slope is 1. So, I look for a value of 1 in the "LINEST()" cell by changing m, using Excel "Goal Seek" in the "What_if Analysis." The closer to 1 LINEST() is, the closer the predicted and observed values are.
The percentage differences between current and forecast value changed dramatically. First, the percentages do not grow linearly, and secondly, the lower and top limits are smaller. The percentage differences are undulating in time, and the upper and lower limits are like this:
Confirmed: +0.1% and -0.2%
Deaths: +0.4% and -0.2%
Recovered: +0.4% and -0.6%
Active: +3,0% and -4%%
Use Excel function INDEX(LINEST(known_y's,known_x's,,TRUE),3,1) to calculate R2.
The same result can be achieved by solving the Root Mean Square Error (RMSE), which measures how much error there is between two data sets. In our case, observed COVID-19 and forecast values. The smaller an RMSE value is, the closer the predicted and observed values are. The Excel function for the RMSE is SQRT(SUMSQ(C2:C11)/COUNTA(C2:C11)), in which column C holds the error between the two data sets. Look for the minimum RMSE by changing m. Use Excel Solver to find the minimum RMSE.
The m results using either LINST() or RMSE are almost the same, with a difference between m factors of about 1 millionth.
When R(Confirmed) is decreasing to 1, and R(Active) is less than 1, the country is eradicating the epidemic. Those values are highlighted in green in some of the charts.
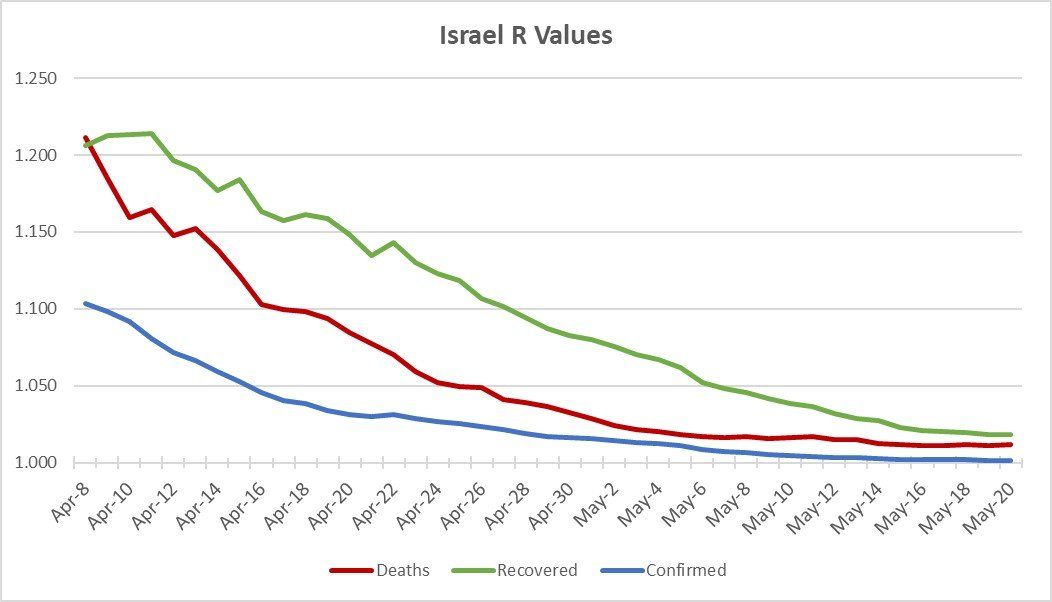
Normalizing Confirmed, Deaths and Recovered Daily Cases
If a country is controlling an epidemic, usually the number of recovered cases per day is higher than the number of deaths and deaths higher than the number of newly infected people. The daily numbers of confirmed, deaths, and recovered are -per-se- challenging to interpret, but R normalized those values, making them easier to compare. Israel is one of the countries where the epidemic has been controlled, and its normalized trajectories of confirmed, deaths, and recovered, are descending smoothly. In an ideal case, on any given day, we want the recovered R rate value (green line) to be the highest, followed by deaths (red line) and last by confirmed (blue line). Remember that the limit for all three R values is 1.
Figure 2
COVID 19 Ratios
R (Active)
R for active cases is calculated for the previous 14-days. R (Active) tells us the average percentage increase or decrease of active cases for the previous 14 days. The threshold here is R = 1, if R > 1, then values are increasing, not good; if R < 1, then values are decreasing, good.
K1-Factor
At any given time, of all the people who were exposed to the virus, confirmed cases, some will die, some will recover, and some will remain infected, -active cases. Then,
Total Confirmed = Total Deaths + Total Recovered + Active Cases
When the epidemic is controlled and starts receding from a location, the number of people who are still infected, active cases, start decreasing to a point at which it will be zero. In that moment
Confirmed = Deaths + Recovered
K1-Factor = (Deaths + Recovered) / Confirmed
K1-Factor generally increases to a limit of 1 as the number of active cases, still infected, people decrease to zero. The closer the K1-Ratio is to 1, the closer a given area is eradicating the epidemic. The K1-Factor can be used to visualize how far in time a country is near to eradicating an epidemic. If the K1-Ratio is decreasing and around 0.5, then the epidemic started to recede.
There is a particular relationship between K1-Ratio and R (Active). When R (Active) changes from 1 to less than 1, which means that active cases start to decrease, the K1-Ratio is around 0.5. Note that K1-Ratio is a snapshot calculation at time t, and R(Active) is over 14 days.
Another correlation that I found was that when the K1-Ratio is around 0.5 and R (Active) is higher than 1, which it should not be, it seems like the numbers for those countries are offset. That was the case for countries such as Iran, Iraq, Iran, and Nicaragua in the initial stages of the epidemic and still in Mexico.
K2-Factor
At any given time, of the people who are still infected, some will die, and some will recover. The K2-Factor shows the proportion of total infected people to people who recovered;
K2 - Factor = Active (Still Infected) Cases / Number of Recovered Cases
When the epidemic has been controlled, the number of still infected people is zero, and the limit of the K2-Factor value is 0.
When the K1, K2 factors, and R(Active) values are plotted together for a country, it is possible to determine how close to flattening the curve the country is. When a country is eradicating an epidemic, the curves look like the ones for Germany or Israel below. When this is happening, the following are some of the relationships between the K-Ratios and R (Active):
- When R (Active) changes from 1 to less than 1, which means that active cases start to decrease, the K1-Ratio is around 0.5.
- The R (Active), the green line, crossed the value of 1 and remained below 1.
- The K2-Factor, blue line, and R (Active), the green line cross around 1.
- The K2-Factor, the blue line, and the K1-Factor, the red line, cross around 0.6.
- The K1-Factor, the red line, is increasing to its limit of 1.
- The K2-Factor, the blue line is decreasing to its limit of 0.
- The K1-Factor follows R (Confirmed), but in opposite directions. For example, if the K1-Factor stops increasing and starts decreasing, it means that the rate of confirmed cases is increasing in that location—the same vice-versa.
- The K2-Factor follows the rate of change of Active and Recovered cases. For example, if the K2-Factor stops decreasing and starts increasing, it means that there are more active, still sick, people or a lower number of people are recovering—the same vice-versa.
- Because the limits of K1 and K2 are based on the number of Active cases been zero, then when K1 is 1, K2 must be zero.
Download the paper "Guide to COVID-19 Ratios" to learn about these ratios, how they are calculated and their limits.

Implementing Control Measurements to Reduce the Rate of increase of New Cases
At any given time t +1, if

Where,
𝜷 (beta) = R(Confirmed) is the transmission rate, the number of people an infected person infects per unit of time.
𝜸 (gamma) = R(Deaths) is the mortality rate. The portion of infected people who die per unit of time.
𝜹 (delta) = R(Recovered) is the rate of recovery. The portion of infected people who become healthy per unit of time.
μ (Mu) = a variable parameter used to reduce R(Configured) for the simulation.
Then,
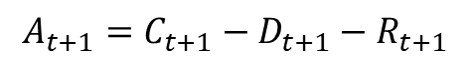
Control measurements slow down the viral spread in the community, and epidemiologists calculate the additional percentage reduction (μ). Data-driven compartmental models can make accurate short-term forecasts for exploring hypothetical control measurements. For example, according to German researchers, masks can reduce the growth rate of coronavirus infections by 40% (μ), grey line.
In the US, on July 1, 2020,
𝜷 (beta) = R(Confirmed) = 1.5622%; 𝜸 (gamma) = R(Deaths) = 0.5666%; 𝜹 (delta) – R(Recovered) = 1.5056%;
Leaving 𝜸 (gamma) = R(Deaths) and 𝜹 (delta) = R(Recovered) the same as for July 6th, It is possible to plot At+1 for different values of 𝜷 – μ.
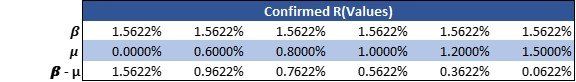
In the simulation, 𝜷 – μ is the reproduction rate of Confirmed cases. When control measures are implemented, it is expected that a percentage, μ, will reduce the reproduction rate R to 𝜷 – μ. If μ = 1.5% and Confirmed cases reproduction rate, 𝜷 – μ, increase daily by only 0.0622%, then there will be zero Active cases, people still infected, by September 23rd, as shown in the July 1st Forecast. Otherwise, if no control measures are implemented, μ = 0, and Confirmed cases continue to grow daily at 1.5622%, the number of Active cases by September 29th will be 7,956,772. The same procedure was used for the updated chart of August 1st.
The following charts show two simulations of how USA Active cases decrease as 𝜷 (beta) = R(Confirmed) is reduced by μ.

Data Collection
The country’s global data used in this web site is from the data repository for the 2019 Novel COVID-19 Visual Dashboard operated by the Johns Hopkins University Center for Systems Science and Engineering (JHU CCSE). All the data collected by JHU CSSE is made freely available at the GitHub repository. The GitHub repository creates three-time series for Confirmed, Deaths, and Recovered cases. These time series are updated once every 24 hours after midnight GMT+0 (7:00 PM CST).
https://gisanddata.maps.arcgis.com/apps/opsdashboard/index.html#/bda7594740fd40299423467b48e9ecf6
https://github.com/CSSEGISandData/COVID-19/tree/2ea13b3e9bd1222b22a58bed8c639af744aeef83/time_series
JHU CSSE confirms the case numbers using regional and local health departments, namely the China CDC (CCDC), Hong Kong Department of Health, Macau Government, Taiwan CDC, European CDC (ECDC), the World Health Organization (WHO), as well as city and state-level health authorities. For city-level case reports in the U.S., Australia, and Canada, the CSSE relies on the US CDC, Government of Canada, Australia Government Department of Health, and various state or territory health authorities. All manual updates (outside mainland China) are coordinated by a team at JHU CSSE.
https://systems.jhu.edu/research/public-health/ncov/
The US states and Texas county data used on this website are from the University of Virginia’s Network Systems Science and Advanced Computing (NSSAC). County-level rendering for the United States, and state/province-level statistics for China, Argentina, Austria, Brazil, Belgium, Canada, Chile, Colombia, Germany, Greece, India, Italy, Mexico, Peru, Portugal, Saudi Arabia, South Korea, Sweden and Switzerland.
https://nssac.bii.virginia.edu/covid-19/dashboard/
Calculating Number of Recovered Cases
A WHO study says mild cases recover in 14 days, and severe or critical from 3-6 weeks. https://www.who.int/docs/default-source/coronaviruse/who-china-joint-mission-on-covid-19-final-report.pdf
Also, According to the CDC, 81% of COVID cases are mild cases, 14% are severe, and 5% are critical. https://www.cdc.gov/coronavirus/2019-ncov/hcp/clinical-guidance-management-patients.html#clinical-course
Because reported recoveries are not available for some regions, and based on the premises above, the University of Virginia’s Network Systems Science and Advanced Computing (NSSAC) introduced a formula to estimate the number of Recovered cases.
The estimation is calculated as follows:
Estimate = (81% of confirmed cases from 14 days ago + 14% of confirmed cases from 28 days ago + 5% of confirmed cases from 42 days ago ) – Deaths
Estimated Recovered = the higher value (reported recovered, estimate)
Recommended Tracking Sites
https://gisanddata.maps.arcgis.com/apps/opsdashboard/index.html#/bda7594740fd40299423467b48e9ecf6
https://www.covidvisualizer.com/
Test, Track and Quarantine Exposed Citizens
There were two actions taken in South Korea and China that helped to control the COVID-19: (1) Testing and more testing and (2) Supplying free testing and treatment to all the population. Continuous testing reduces R by isolating the sick population in their homes or hospitals. Delays in diagnosing the virus are major obstacles to controlling the epidemic. The South Korea government’s goal is Trace, Test, and Treat to be able to isolate and treat quickly. Since testing is free, South Koreans volunteer to get tested. People believe in “better to know so I am not a danger to others.”
South Korea can produce 140,000 testing kits a week, and nearly 20,000 people are being tested every day.